# Python Library
The Meteostat Python library provides simple access to open weather and climate data using Pandas. Historical observations and statistics are obtained from Meteostat's bulk data interface and consist of data provided by different public interfaces, most of which are governmental. Among the data sources are national weather services like the National Oceanic and Atmospheric Administration (NOAA) and Germany's national meteorological service (DWD).
Donation
Help Meteostat provide free weather and climate data by making a donation.
# Installation
The Meteostat Python package is available through PyPI (opens new window):
pip install meteostat
Meteostat requires Python 3.6 or higher. If you want to visualize data, please install Matplotlib, too.
# Example
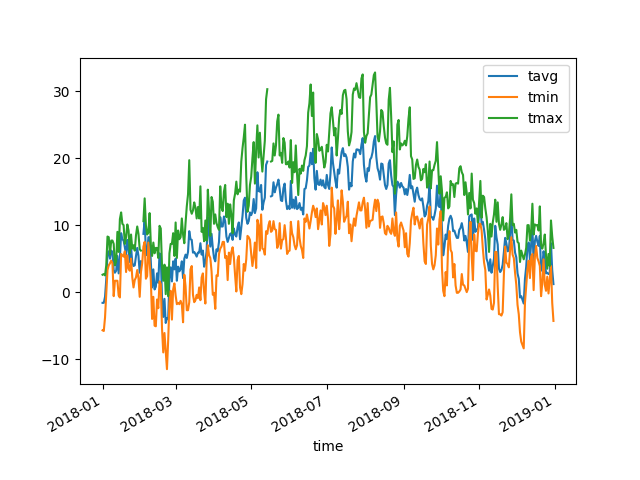
Let's pretend you want to plot temperature data for Vancouver, BC from 2018:
# Import Meteostat library and dependencies
from datetime import datetime
import matplotlib.pyplot as plt
from meteostat import Point, Daily

# Set time period
start = datetime(2018, 1, 1)
end = datetime(2018, 12, 31)

# Create Point for Vancouver, BC
vancouver = Point(49.2497, -123.1193, 70)

# Get daily data for 2018
data = Daily(vancouver, start, end)
data = data.fetch()

# Plot line chart including average, minimum and maximum temperature
data.plot(y=['tavg', 'tmin', 'tmax'])
plt.show()
# Output