Meteostat Python
The Meteostat Python library offers an easy and efficient way to access open weather and climate data through Pandas. It retrieves historical observations and statistics from Meteostat’s data access interface, which aggregates information from various public sources — primarily governmental agencies. Among Meteostat’s data providers are national weather services such as the National Oceanic and Atmospheric Administration (NOAA) and Germany’s Meteorological Service (DWD).
📚 Installation
The Meteostat Python package is available through PyPI:
pip install meteostat
🚀 Usage
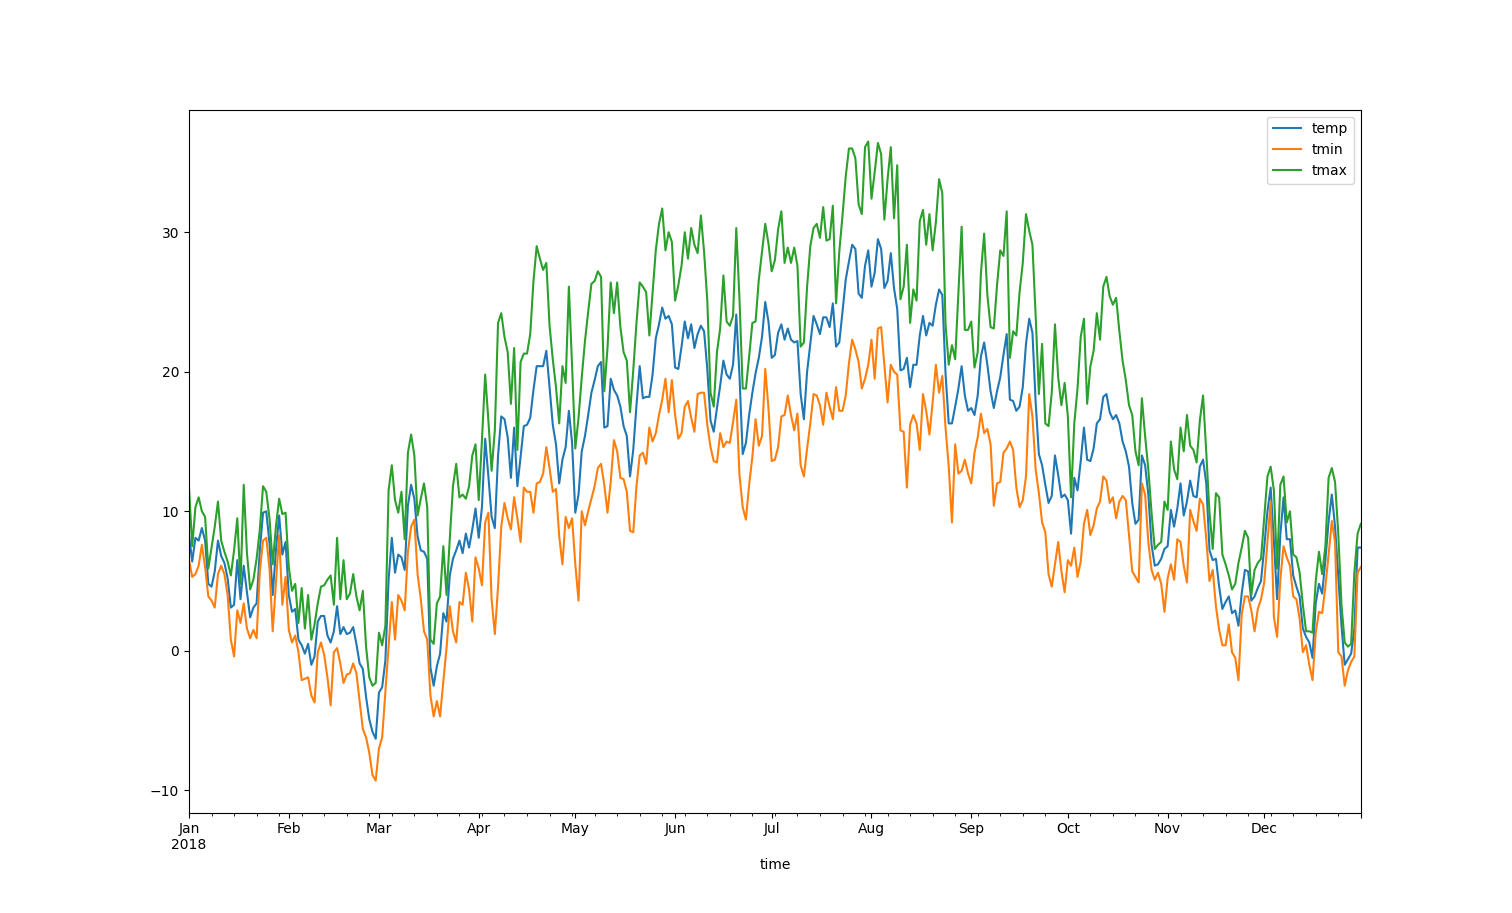
Let's plot 2018 temperature data for Frankfurt, Germany:
from datetime import date
import matplotlib.pyplot as plt
import meteostat as ms

# Specify location and time range
POINT = ms.Point(50.1155, 8.6842, 113)  # Try with your location
START = date(2018, 1, 1)
END = date(2018, 12, 31)

# Get nearby weather stations
stations = ms.stations.nearby(POINT, limit=4)

# Get daily data & perform interpolation
ts = ms.daily(stations, START, END)
df = ms.interpolate(ts, POINT).fetch()

# Plot line chart including average, minimum and maximum temperature
df.plot(y=[ms.Parameter.TEMP, ms.Parameter.TMIN, ms.Parameter.TMAX])
plt.show()
This is how the resulting chart looks:
👀 Learn More
📄️ Overview
The Meteostat Python library offers an easy and efficient way to access open weather and climate data through Pandas. It retrieves historical observations and statistics from Meteostat’s data access interface, which aggregates information from various public sources — primarily governmental agencies. Among Meteostat’s data providers are national weather services such as the National Oceanic and Atmospheric Administration (NOAA) and Germany’s Meteorological Service (DWD).
🗃️ Time Series
3 items
📄️ Climate Normals
Climate normals represent the average meteorological conditions, typically over a 30-year period. They are commonly used as a reference to compare current weather conditions against long-term averages. Climate normals are based on monthly weather data and can be requested for any period.
🗃️ Weather Stations
3 items
📄️ Geographical Points
Meteostat allows you to define geographical points using latitude, longitude, and optional elevation. These points can be used to retrieve weather data for specific locations that may not have a dedicated weather station. Points are also used as input for functions that require a location reference. The Point class in the Meteostat Python library provides a simple way to create and manage these geographical points.
📄️ Data Providers
Meteostat integrates data from various weather data providers to offer comprehensive meteorological information. Each provider has its own set of meteorological parameters, data coverage, and update frequency. The Meteostat Python library allows you to access data from these providers seamlessly.
📄️ Interpolation
Meteostat provides interpolation methods to estimate weather data at specific geographical points based on nearby weather stations. This is particularly useful for locations that do not have a dedicated weather station. The interpolation methods take into account the distance and elevation differences between the point of interest and the surrounding stations to provide accurate estimates.
📄️ Lapse Rate
Meteostat provides a function to calculate the lapse rate for temperature parameters based on weather data from multiple stations. The lapse rate is defined as the rate of temperature change with elevation and expressed in °C per 1000 meters. The standard lapse rate in the troposphere is approximately 6.5 °C per 1000 meters, but actual values can vary based on local atmospheric conditions.
📄️ Configuration
The Meteostat Python library allows you to customize its behavior through a configuration system. You can set various options that affect how data is retrieved, cached, and processed. The configuration can be modified at runtime using the meteostat.config module.
🗃️ Contributing
2 items
🗃️ API Reference
27 items